A chart web part for a SharePoint list without Power BI
You have a SharePoint list and you want a simple bar chart from it on a page. Tickets by status, requests by category, that sort of thing. You do not want to stand up Power BI just for that. Here is a web part that charts a list directly.
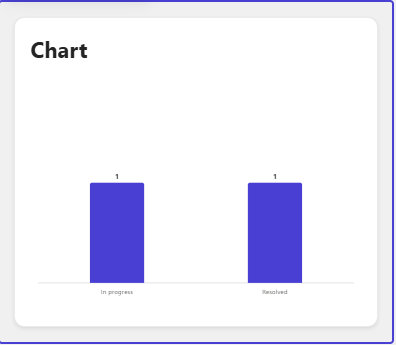
You point it at a list and choose a Group by column. It counts the rows in each group and draws a bar for each one. Leave the Value column blank to count items, or set a numeric column to sum it instead. The column names are the internal names.
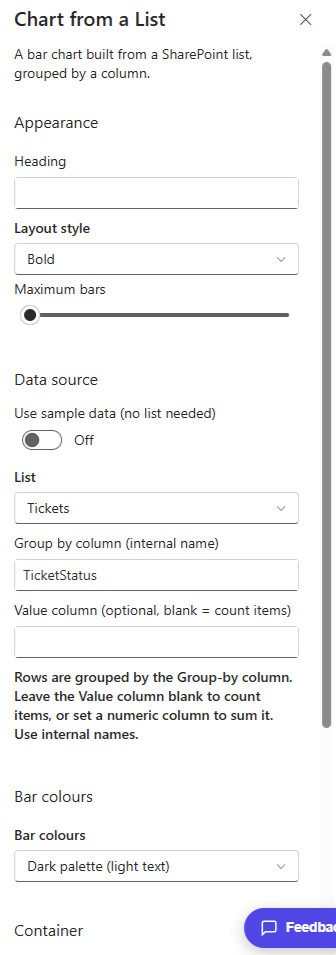
In the property pane you pick the List, the group-by column, an optional value column, a layout, and the Bar colours palette. The example groups a Tickets list by its status column, so each bar is one status.
Chart from a List is part of my open source SPFx Intranet Suite, a set of web parts for a modern SharePoint intranet. Install the package once and it shows up in the toolbox under Intranet Suite.



One Comment
Comments are closed.